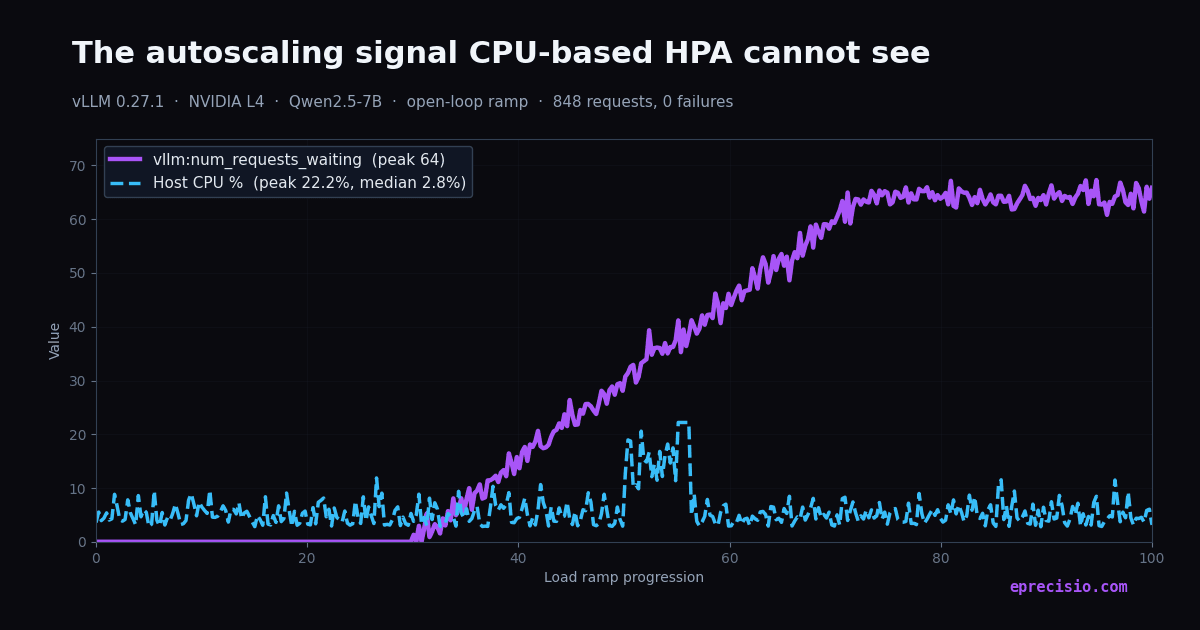
On our test node the vLLM engine's waiting queue went from 0 to 64 requests while host CPU stayed at a median of 2.8 percent and peaked at 22.2 percent. A Kubernetes Horizontal Pod Autoscaler watching CPU would not have fired. Not late, not weakly. It would not have fired at all, because nothing it was watching moved.
Every request in that run succeeded: 848 requests, zero failures. The service was degrading badly (p95 time to first token across the ramp reached 134,057 ms) and the only metric that showed it was one most Kubernetes autoscaling setups do not scrape. Below: the measurement, the metric name to alarm on, a sharper variant vLLM 0.27.1 exposes, and the mistake we made on the first attempt that produced a convincing chart of nothing.
This is first-party evidence from the Eprecisio hardware baseline pilot, run on a Google Cloud G2 instance with an NVIDIA L4 accelerator. Every number below traces to a machine-generated summary.json or per-request record from a specific run, and each run is identified inline by its full run ID so any figure here can be tied back to the record it came from. Software versions, hazards, and gate criteria were fixed before the runs started, not chosen afterwards. The pilot repository is not public. If you want the raw records behind a particular run ID, ask us for them and we will send them over.
The finding, in one chart
The whole argument fits on one time axis: waiting requests on top, host CPU on the bottom, p95 TTFT alongside, on the same monotonic clock. This is the actual chart generated by the pilot's report harness from run 20260818T161955Z_E6_scaling_5dd1e1, not a redraw.
The waiting queue climbs to 64 as the open-loop ramp pushes past capacity. Host CPU never leaves idle. p95 TTFT rises with the queue, not with CPU. That is the entire story of why CPU-based autoscaling misses inference: the CPU signal you were counting on is not going to rise, because the work is on a different device.
The mechanism, stated out loud
Serving work happens on the GPU. The host process spends its time waiting on the device, so host CPU does not rise when the engine saturates. Queue depth does, because queue depth is by definition the number of requests the scheduler could not admit.
The behaviour is symmetric next door. A CPU contention run we did later loaded every host thread with a CPU benchmark and p95 time to first token moved from 3,780 ms to 3,795 ms. That is 15 ms on a 3.8 second figure, with no measurable throughput change. Same cause: CPU was never the constraint, so with a 2.8 percent baseline the experiment had no room to show an effect and a null result was the correct outcome.
That null does not generalise. A node with more GPU per vCPU, a faster card, a smaller model, or a tokeniser-heavy workload could put real load on the host. CPU would still move later and less legibly than the queue, but "never fires" would be too strong. Rerun the contention arms on your own node before adopting it as a universal claim.
The metric name to alarm on
The metric is:
`
vllm:num_requests_waiting
`
Do not hard-code metric names in your scraper. A script with a hard-coded name that no longer exists records nothing while continuing to exit zero, silently destroying a run's most important series. The load framework in this pilot fetches the live /metrics endpoint at run start, matches each canonical field against an ordered candidate list, tries counter names with and without a _total suffix, records the mapping in manifest.metric_discovery, and refuses to start a measured run if a required field is unresolved. On this stack it found 122 names available and resolved waiting_requests to vllm:num_requests_waiting.
If you take one metric name away from this post, take vllm:num_requests_waiting.
The sharper metric most people miss
vLLM 0.27.1 also exposes:
`
vllm:num_requests_waiting_by_reason
`
It appears in the available-name list of every one of the 11 run manifests in this pilot and is captured in every 1 Hz engine sample. It is labelled by reason, and the reason is the actionable part. A request waiting for scheduling capacity is one another replica would fix. A request deferred by a transient constraint (LoRA budget, KV transfer, blocked status) is one another replica would not fix. Scaling out on the second kind is buying a card to solve a bookkeeping delay. The plain gauge is the union of both, so it is a signal you should act on added to one you should not.
Two honesty notes, because this is the claim most likely to get quoted:
- Our sampler discards
#comment lines and sums label variants of a name into one number, so noHELPorTYPEline and no label value was ever written to disk by this benchmark. The metric name and its per-second values are recorded. The reason label spellings come from our notes, not from a captured Prometheus dump. Confirm them against your own endpoint before you write an alert rule. - What we can verify from the raw records is the relationship. Because label variants are summed, the recorded
vllm:num_requests_waiting_by_reasonvalue is the sum over reasons, and across all 2,656 samples of this run it equalledvllm:num_requests_waitingin 2,656 of 2,656 samples, zero mismatches, both peaking at 64. The two metrics are consistent, which is what makes splitting by reason a free refinement rather than a second opinion.
Get the real text off your own vLLM in one line:
`bash
curl -s localhost:8000/metrics | grep -B2 -A4 'num_requests_waiting'
`
If you scrape only the plain count, you will eventually scale out on a deferral spike. If you scrape neither, you have no serving signal at all.
The Kubernetes wiring
The metric turns into autoscaling via one of two adapters. Both work, they trade convenience for coupling.
Prometheus Adapter is the direct path if you already run Prometheus. Expose vllm:num_requests_waiting through a custom-metric rule, then reference it from a standard HorizontalPodAutoscaler on type: Pods. This keeps your metric surface in one place, at the cost of writing a rule.
KEDA is the shortest path if you do not want to touch Prometheus Adapter. A single ScaledObject with the Prometheus scaler and a query clause pointed at vllm:num_requests_waiting gets you there in one YAML. KEDA also has a scale-to-zero behaviour that Prometheus Adapter does not, which matters for spiky inference workloads.
The metric is the same in both cases. The trigger you build on top of it is the interesting choice, and the sharper variant is the one to build it around:
`
# scale out only when the scheduler genuinely has no room,
# never on a deferral spike caused by a transient constraint
max_over_time(vllm:num_requests_waiting_by_reason{reason="capacity"}[2m]) > 4
`
The threshold of 4 above is a starting point, not a universal. It is the number of consecutive samples where a real capacity shortfall would sit before a scale-out is worth its startup cost. Tune from your own p95 TTFT budget and the pod cold-start time on your image.
Why the ramp has to be open-loop
Closed-loop load holds a fixed number of requests in flight and dispatches a new one only when one completes. Arrival rate is therefore a function of service rate, and the queue is bounded by construction: it can never exceed the configured concurrency. That is right for a capacity curve, because concurrency is the variable a client actually sets, and it makes the signal in this post impossible to observe. A queue that cannot grow past your concurrency setting cannot demonstrate an unbounded queue.
Open-loop dispatches on a schedule drawn from an exponential distribution regardless of what has completed, so arrivals are independent of service and the queue grows without bound once arrivals pass capacity. The price is unbounded in-flight accumulation, which is why our ramp steps back down at the end. The drain is part of the evidence, and a queue that does not drain is a different finding from one that does.
Rule of thumb: use closed-loop for capacity curves, use open-loop when you need the autoscaling signal. Never confuse a closed-loop chart with proof that autoscaling triggers work.
The mistake we made on the first attempt
The first version of this experiment (results/20260818T150233Z_E6_scaling_1fcccd, void, kept as evidence, hazard H-29) failed 6,247 of 7,827 requests, 79.8 percent. The queue-depth chart still looked convincing. We nearly published it.
That is the void chart, kept in the repo because a convincing chart from an invalid run is exactly the failure mode to warn against. The queue peaks at 503, host CPU still holds a 3.0 percent median, and directionally the story looks the same as the real one above. Read below for why it is not.
Two compounding errors.
We picked absolute arrival rates before measuring capacity. The ramp stepped 0.5, 1.0, 2.0, 4.0, 8.0 requests per second. Measured request capacity at the knee on this node is 0.332 requests per second. The top step was 24x overload. Under open-loop arrivals nothing throttles dispatch, so in-flight requests grew without bound. Recomputed from the raw records: at 0.5 rps, 162 of 162 succeeded (100.0%). At 1.0 rps, 220 of 320 (68.8%). At 8.0 rps, 285 of 3,427 (8.3%). Everything above the second step measured collapse, not capacity.
Most of the recorded failure was our own client. The load runner's connection pool held 512 connections against an in-flight ceiling of 2,048. Once in-flight passed 512, every further request waited for a connection and failed with PoolTimeout. Broken out by class from the error strings in requests.jsonl.gz: 3,720 records beginning PoolTimeout: against 2,527 beginning read stall timeout:. The majority of a 79.8% failure rate was the load generator saturating. An aggregate error rate cannot tell you that.
The fixes were cheap and both generalise.
- Express the ramp as multiples of measured capacity, not in absolute rates, so it brackets capacity instead of vaulting over it. The corrected ramp took
base_rpsfrom the capacity sweep and stepped at 0.5, 0.8, 1.0, 1.3, 1.6, 1.0, and 0.5 times it. On this node that was 0.166, 0.266, 0.332, 0.432, 0.531, 0.332, 0.166 requests per second. That produced 848 requests with zero failures and a queue peak of 64. That is a measurement of the server. - Make client-side limits self-describing. The connection pool was raised above the in-flight ceiling, and
PoolTimeoutnow carries a message saying plainly that it is a load-runner limit and not a server failure, so it can never be read as a capacity finding.
The general lesson: a load generator has its own saturation point, and a benchmark that crosses it stops measuring the system under test. Sockets, file descriptors, event-loop capacity, and CPU on the generator side belong in the preflight, not in the results. Break your error rate out by class and read the messages. A failure class that names a client-side resource is a load-runner limit.
The node under test
Documented so you can replicate.
- Cloud: Google Cloud Compute Engine, G2 machine family,
g2-standard-8ineurope-west4. Provisioned via standard GCE with the NVIDIA L4 GPU accelerator attached and the Deep Learning VM CUDA 12.4 base image as the boot disk. - Hardware: 1x NVIDIA L4 (23,034 MiB, sm_89, 58 SMs, driver 580.173.02, CUDA 13.0, PCIe gen3 x16, power limit fixed at 72 W, passively cooled).
- Host: 8 vCPU Intel Xeon at 2.20 GHz, 31.3 GiB RAM, Ubuntu 24.04.4.
- Engine:
vllm/vllm-openai:v0.27.1-x86_64(vLLM 0.27.1, torch 2.13.0+cu130). - Model:
Qwen/Qwen2.5-7B-Instruct, served atmax_model_len32,768 withmax_num_seqs256. - Prompt corpus: generated once per run from seed 20260818, hashed with SHA-256, reused across every arm. Prompt lengths from the model's own tokeniser.
- Sampling: 1 Hz on GPU and on the engine /metrics endpoint, written straight to JSONL, timestamped on
CLOCK_MONOTONICin the same process as the request records so the three series align without clock skew. - Every request recorded, no retries, failures stay in the denominator of every rate.
- Warmup flagged, never dropped: 60 s or 50 completed requests, whichever is later, capped at 180 s. Of the 848 records here, 416 were flagged and 432 kept, and all 848 are on disk.
Run id: results/20260818T161955Z_E6_scaling_5dd1e1.
What would change our mind
- A CPU-heavy serving configuration. The flat-CPU result depends on the GPU being the binding resource by a wide margin. On this node the GPU is power-limited to roughly half its boost clock, so CPU headroom is abundant. A faster card, a smaller model, higher request rates, or a tokeniser-heavy workload could put real load on the host. CPU would still move later and less legibly than the queue, but "never fires" would be too strong.
- A different arrival process. Ours is Poisson. Bursty or correlated arrivals change the queue shape and may change how much lead time the signal buys before latency degrades. We measured that the signal exists, not how many seconds of warning it gives.
- A queue that never builds. If the top ramp step does not exceed capacity, the experiment shows nothing and needs to go higher. That is the failure mode opposite to what killed the first run.
- Scope. One card, no NVLink, no multi-GPU axis. Answer quality is not measured anywhere. The queue peak of 64 is a property of our ramp shape, not a universal. The metric name and the mechanism are what transfer.
Related work
For the full inference-server stack view (vLLM vs TGI vs KServe on Kubernetes), see vLLM vs TGI vs KServe: which LLM inference server on Kubernetes in 2026. For where the 0.332 rps base rate comes from and how to structure a full capacity sweep, see Scaling ML with Kubernetes: what production actually looks like. If you are budgeting on-prem GPU capacity, GPU workload optimization for Kubernetes clusters walks the same measurement discipline through cost.
If you want a team to instrument, autoscale, and operate vLLM (or any inference stack) on Kubernetes with this level of measurement discipline, our MLOps consulting and InfraOps engagement are structured for it. Or book a 30-minute call with Ehtisham directly.